Health data science software
Since the informatisation of hospital services, many data are available for research in the healthcare sector.
These data are stored in Clinical Data Warehouses (CDWs) within hospitals.
At present, to be able to use these data for research, you need to have advanced knowledge of programming. Indeed, manipulating this data requires skills in SQL, R and Python in particular.
Conducting studies on EDS requires close collaboration between clinicians, data scientists and statisticians.
There are collaborative work platforms such as Jupyter Notebook, where code is mixed with the display of the results of executing that code. Nevertheless, this platform requires programming knowledge and has limited functionality, not being created for the specific purpose of creating studies on EDS data.
On the other hand, there is statistical analysis software, with so-called “no-code” graphical interfaces, enabling statistical analysis to be carried out without any a priori knowledge of programming. This type of software doesn’t usually allow you to modify the code, which is a limiting factor for the data scientist and the development of new functionalities.
This is why LinkR was created.
It’s a web application that allows :
- the
: access health data via a graphical interface, requiring no programming skills
- the
: to manipulate data via a R and Python programming interface
- the
: to learn how to manipulate medical data, both by browsing patient records and by manipulating aggregated data.
In this way, it enables the different stakeholders involved in medical research on EDS to work collaboratively, on a common platform.
Thanks to this common platform adapted to both and
, studies can be carried out much faster, and with the contribution of the specificity of each: the medical expertise of the clinician and the data expertise of the data scientist.
Overview of LinkR
LinkR enables the analysis of data from different sources :
- hospital EDS data
- data from shared databases, such as the MIMIC or AmsterdamUMCdb databases
- data from data repositories, in the form of CSV or Excel files.
Once this data has been imported into LinkR, you can create studies.
Each study will include one or more subsets of patients.

Organising data within LinkR
Once a study has been created, it needs to be configured.
The principle is simple: a study has an “Individual data” page and an “Aggregate data” page.
Individual data
In the individual data page, I create a medical record template according to my needs.
For example, if my study concerns bacterial pneumonia, I will create :
- a tab where reports from medical imageries will be displayed
- a tab where bacteriological results will be displayed
- a tab displaying the antibiotic treatments received by the patient
Benefits :
- the
- the
- the
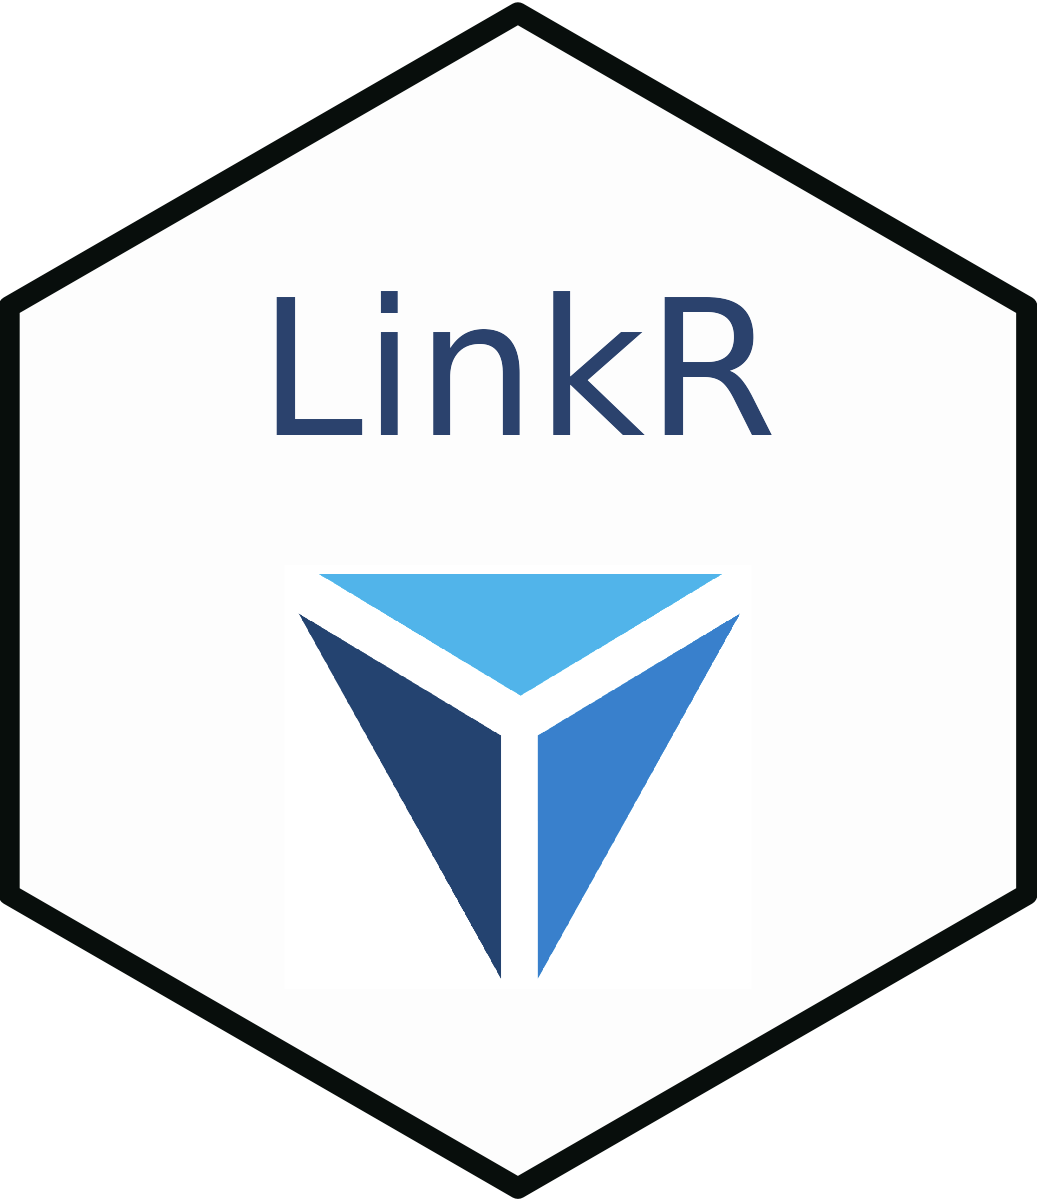
 Individual data tabs with a “Console R” plugin
Aggregated data
Once this is done, we can continue our study by analyzing the aggregated data.
In the same way, I create tabs, corresponding to the different stages of my study :
- to visualize the distribution of data and eliminate outliers **data
- to create and apply exclusion criteria, and
- to create and view the flowchart, and
- to produce the statistics of my study
- to import a bibliography
- to create the report of my study
Each of these examples corresponds to what we call a plugin: it is a script allowing you to add functionality to the application.
We will therefore have a “Flowchart” plugin, a “plugin” Bibliography” etc.
Advantages:
- the
- the
- the
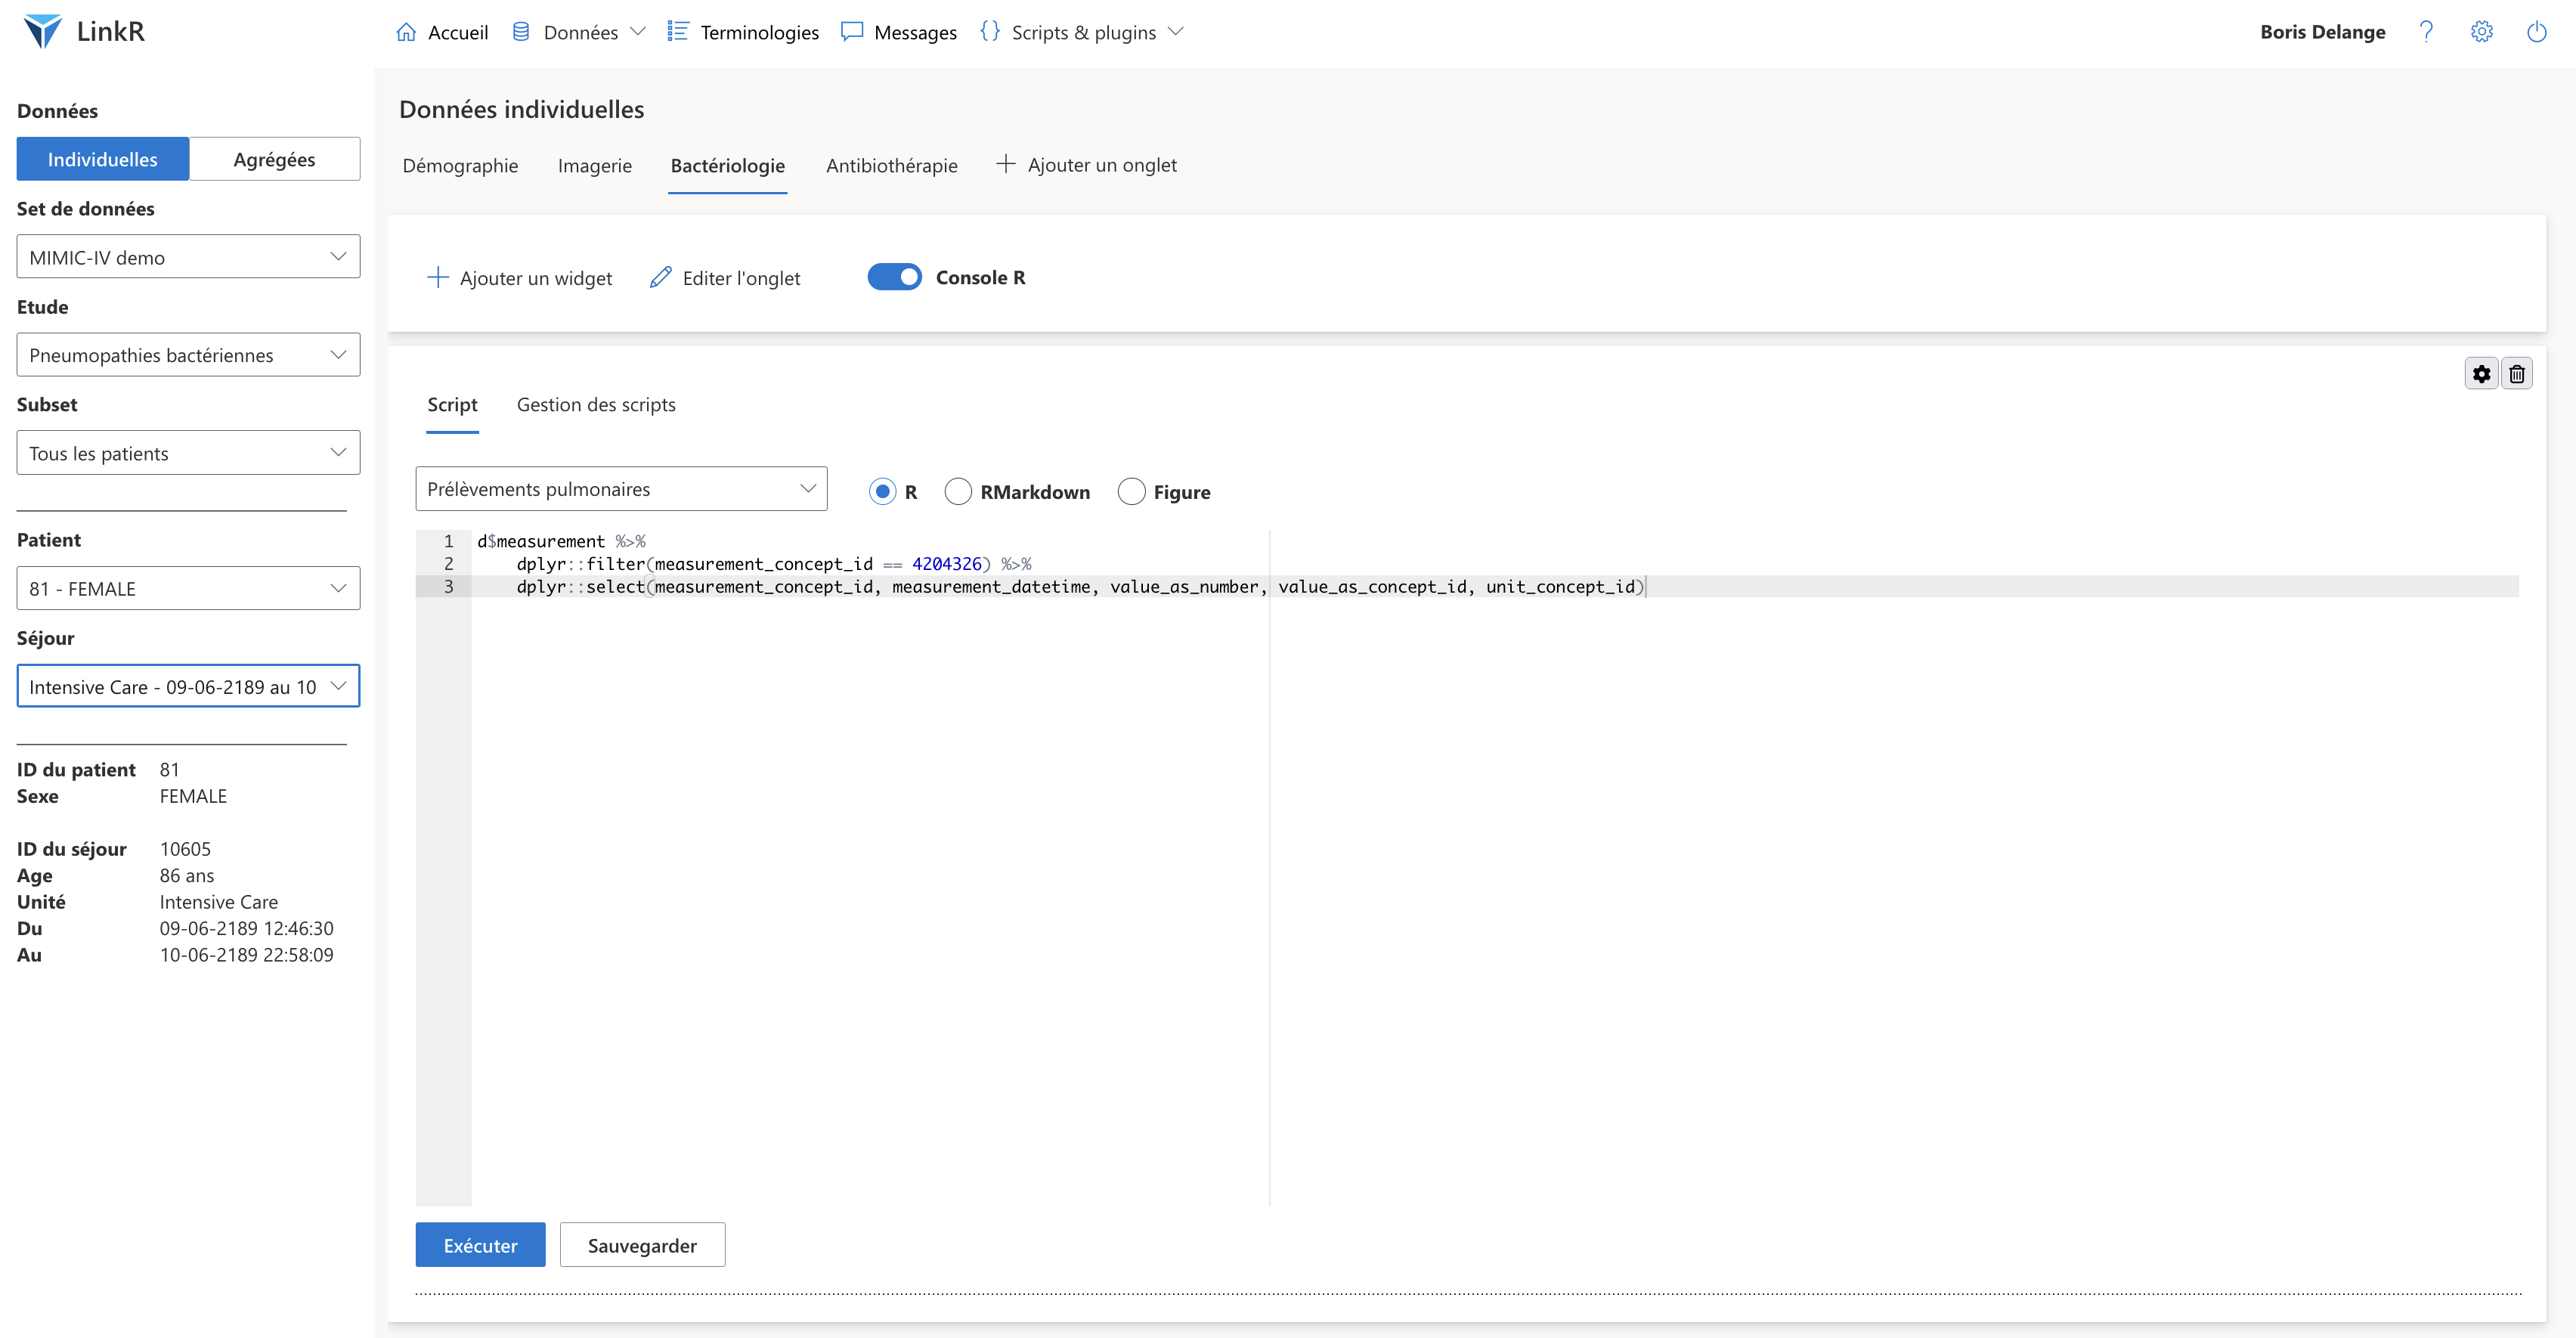
 Aggregated data tabs with a "Figure (ggplot2) plugin"
The different stakeholders can communicate via the “Messages” tab.
So :
- the
- the
- the
Interoperability
LinkR builds on the OMOP Common Data Model, which is a model used by many hospitals around the world.
This allows interoperability of data, it is thus possible to carry out multicenter studies easily, by only coding the study once.
LinkR integrates concept alignment tools, allowing you to match concepts contained in different databases.
For example to match the concept “123456 - Heart rate” from center 1 to the concept “ 456789 - HR (bpm)” from center 2.
It is also possible to share everything you develop within LinkR.
To know :
- studies: if you have completed your study, you can share it with one click to other centers. From the application, they will be able to download your study and launch it on their data.
- data cleaning scripts (what data scientist has never made a script to filter false weights and false sizes, and would not have liked to have one already developed available?)
- the plugins that we saw above
- the data sets: the codes allowing the sets to be loaded are shared, and not the data
- the terminologies: you can share both the code allowing you to load the concepts, but also the concepts of the different terminologies as well as the alignments that you have made
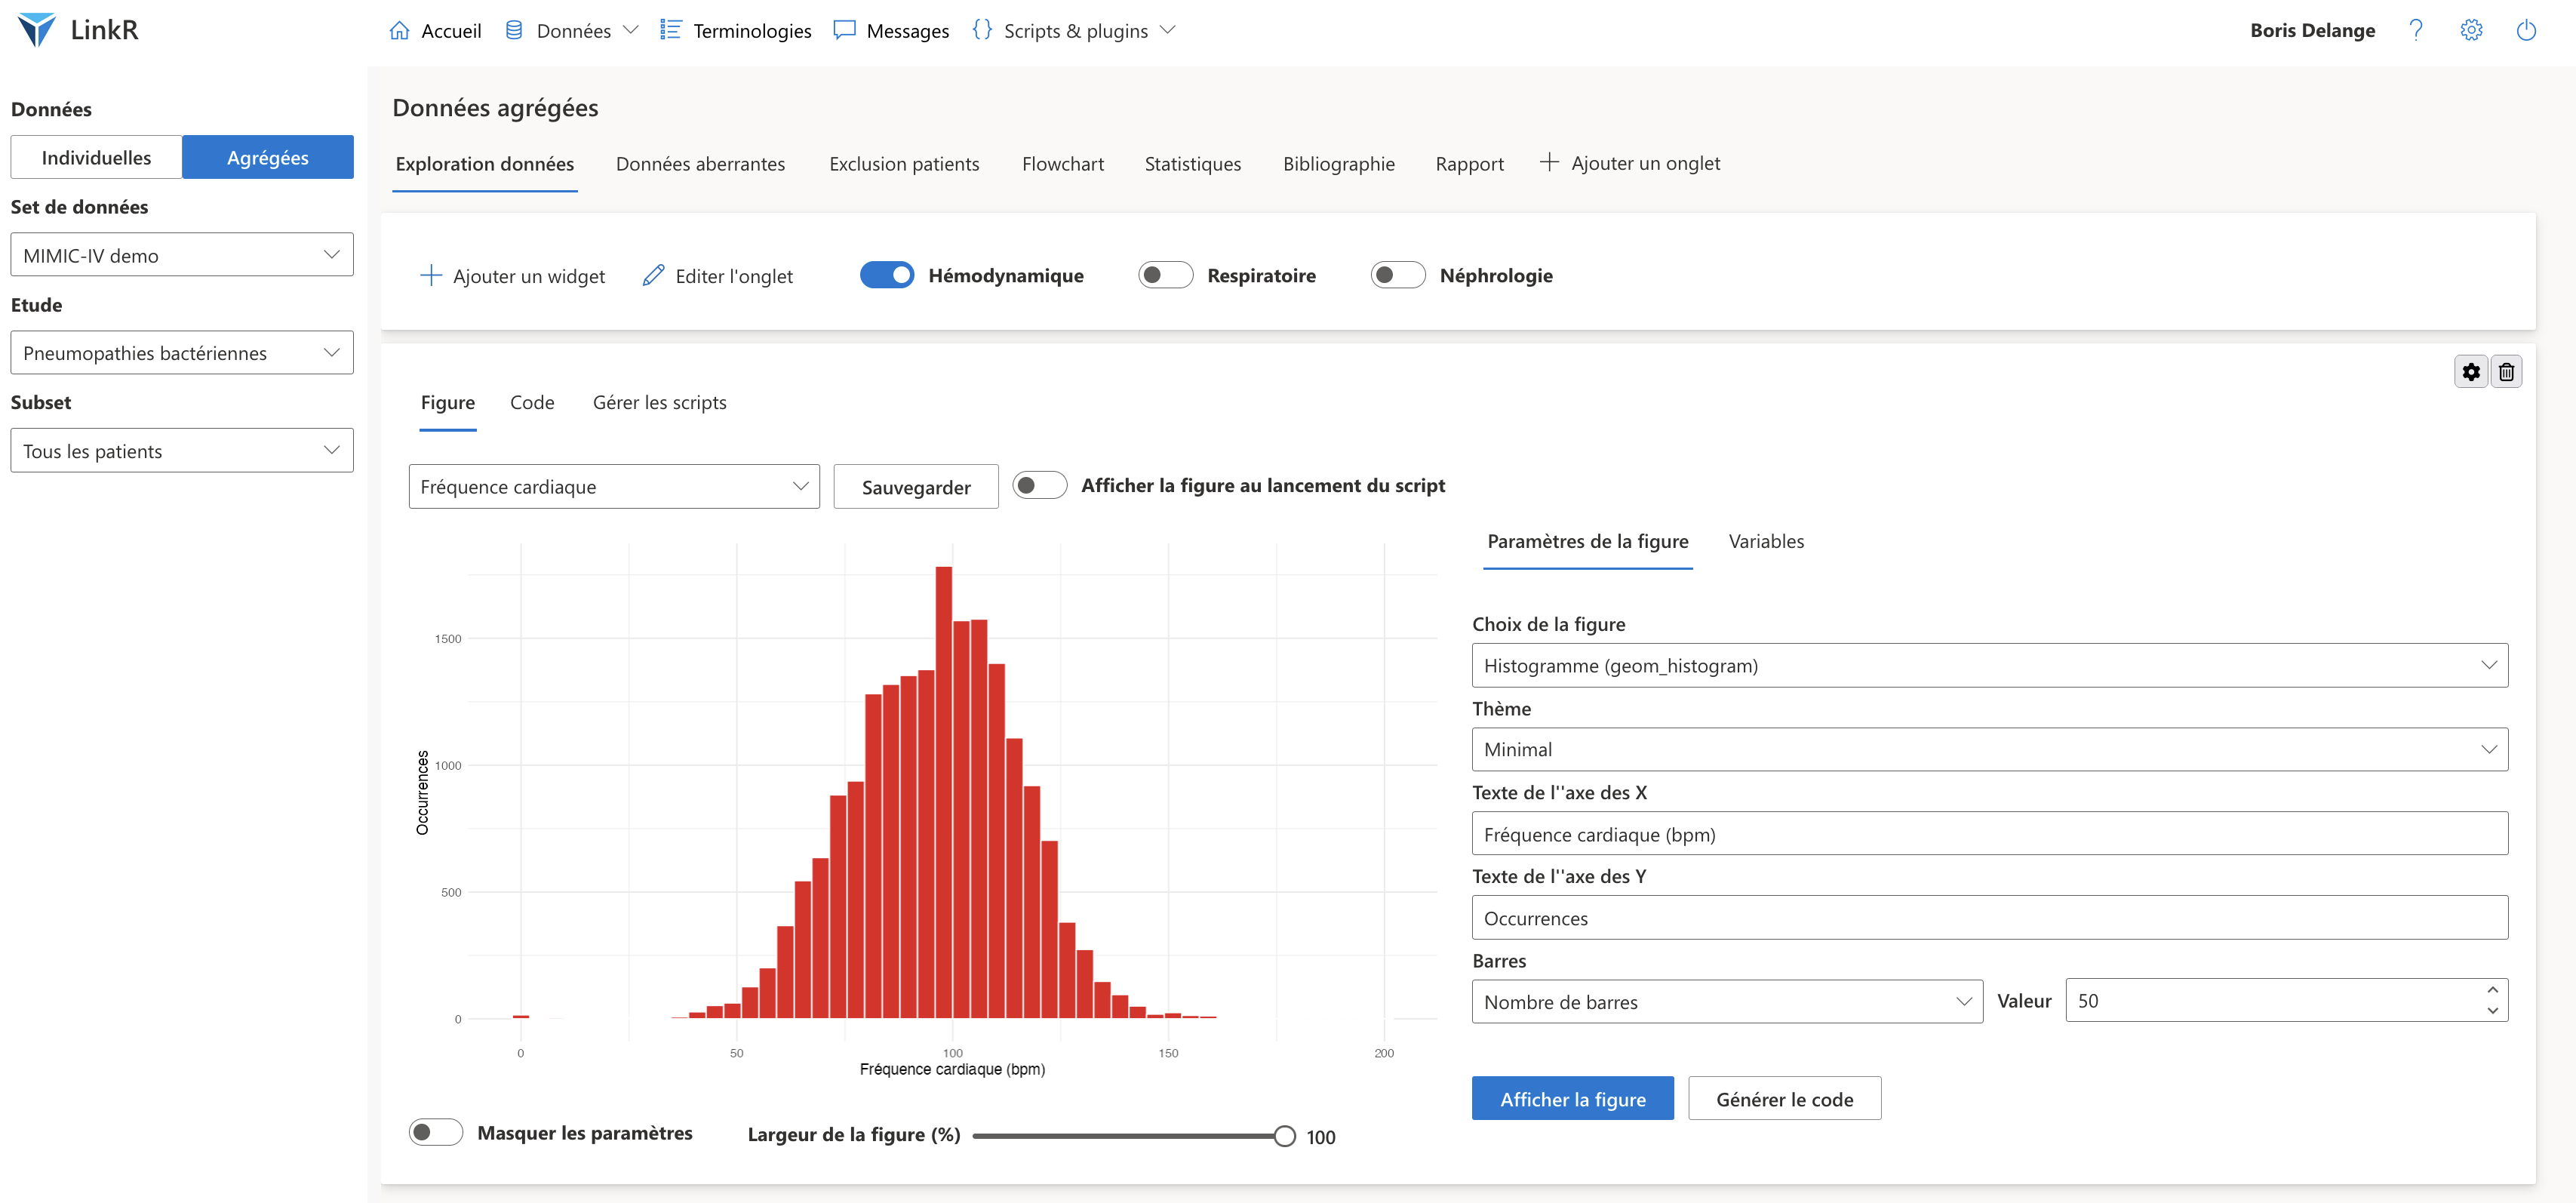
Algorithmic interoperability offered by LinkR
By combining data interoperability as well as algorithmic interoperability (sharing of studies, scripts and plugins), LinkR really allows research to be carried out according to the principles of “Open Science” or open science
This also allows protection of health data: LinkR follows a decentralized architecture, it is the algorithms that travel and not the data.
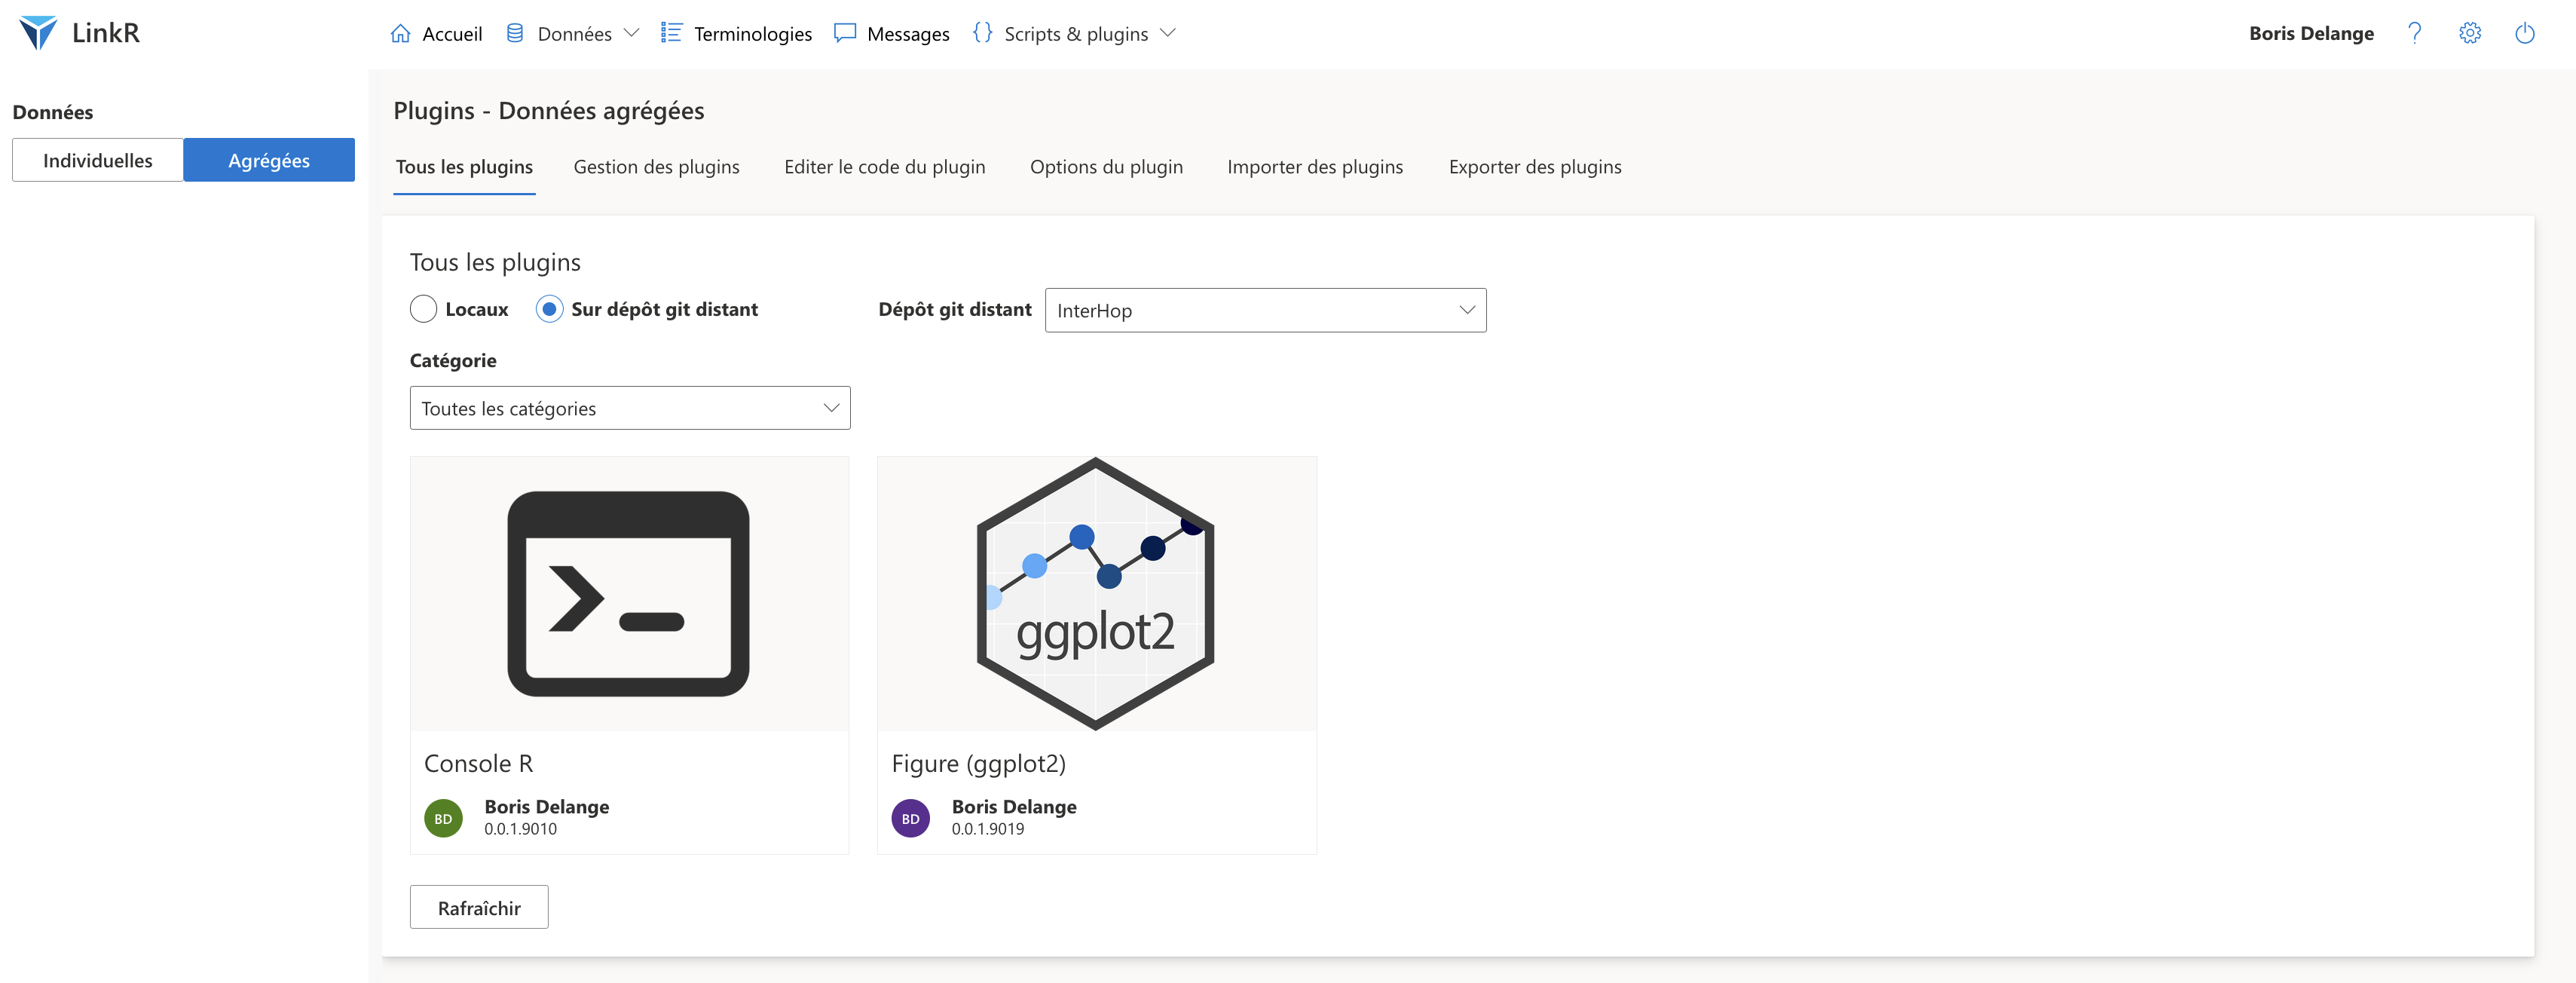
Catalog of plugins available on the InterHop git. Installing a plugin is done in one click.
InterHop’s offer
InterHop already offers data hosting on its HDS servers (health data host), rented from GPLExpert.
The association also suggests using Goupile, an eCRF tool, allowing collect data directly from HDS servers.
InterHop will soon offer use LinkR on HDS servers.
This will make it possible to collect the data and then carry out the studies in the same place, in a secure manner.
InterHop will also provide support for the use of LinkR.
Technical specifications
LinkR is a web application created with the Shiny library in R.
It is open source software, under the GPLv3 license.
The application can be installed via ShinyProxy and protected by SSO authentication.
To install the app, follow the steps given here.
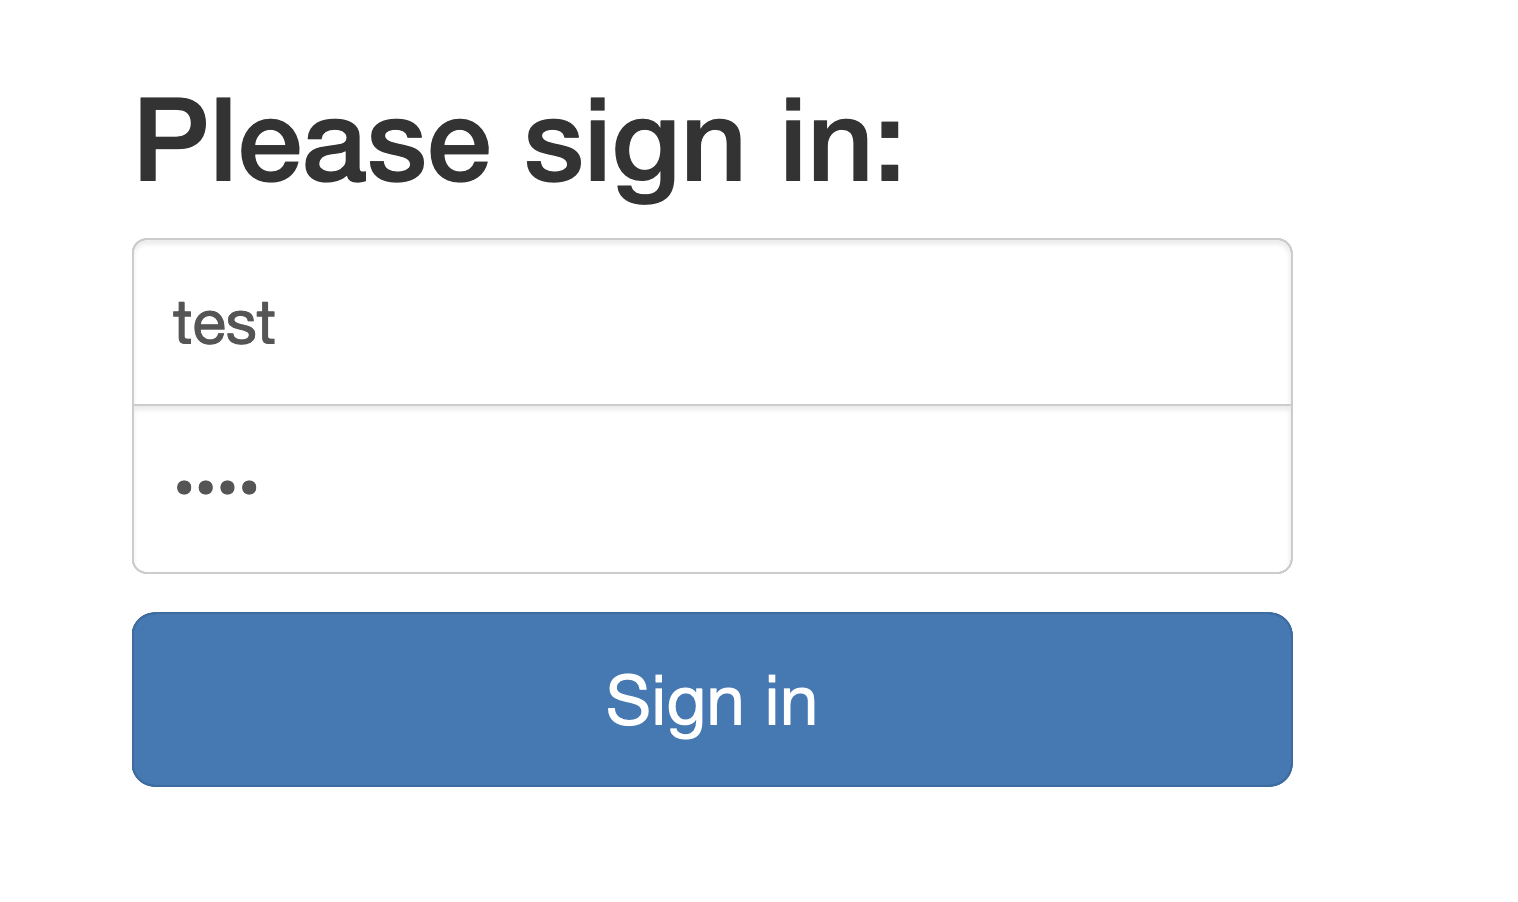
You can also test the app here:
- with the “test” / “test” logs for ShinyProxy (see first image below)
- by clicking on “LinkR - test - v0.2…”
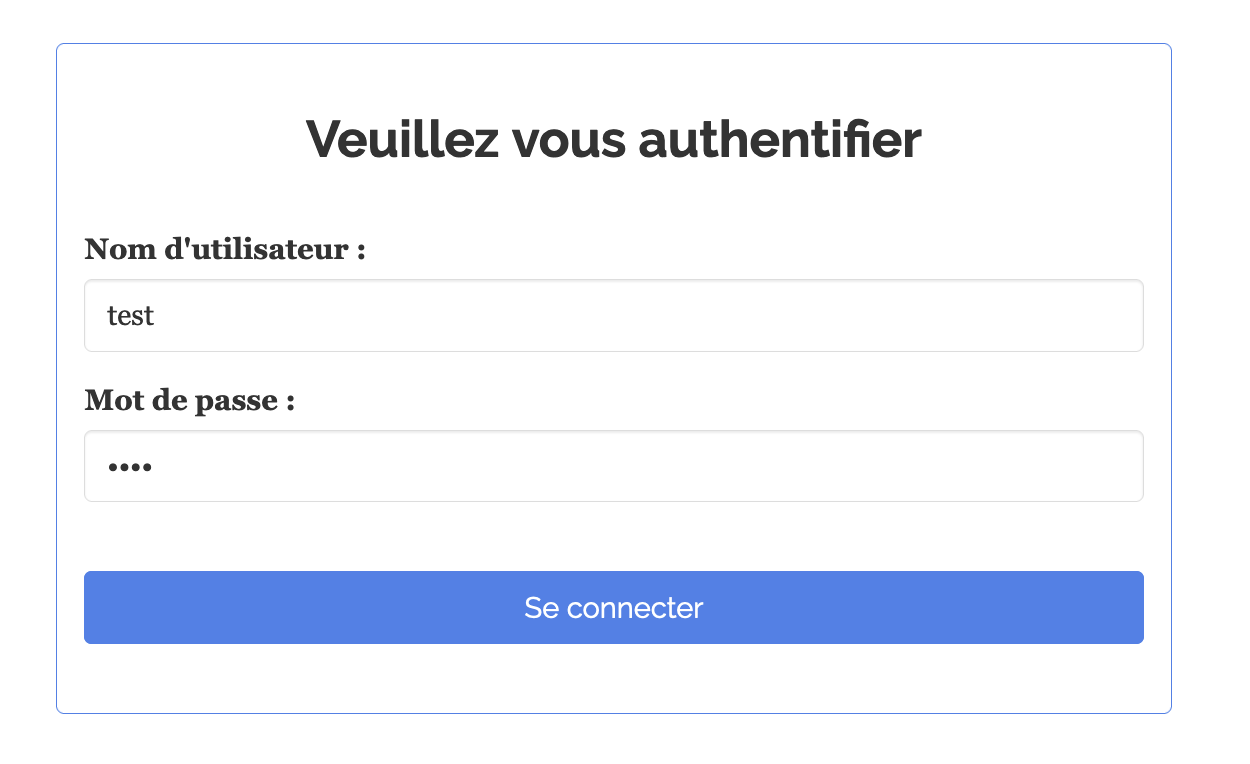
- then again with the “test” / “test” logs for LinkR (see second image below)
Continuation of the project
The current application is a prototype, the goal is to subsequently develop a web application with a backend in Python.
The project being open source and carried out by volunteers, any contribution is welcome!
Connections
Contact
You can contact us by email at linkr-app@pm.me.
You can also contact us via instant messaging and opensource Element. A tutorial to help with connection is available here.
Comments
Leave a comment